You and your teammates can find the list of stand-ups in which their participate and their role in the Home Tab of Slack, as well as in the Web Dashboard.
Home Tab
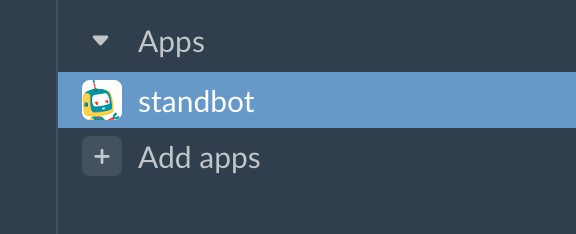
You can access this section by clicking on the StanBot icon in Slack under the Apps menu:
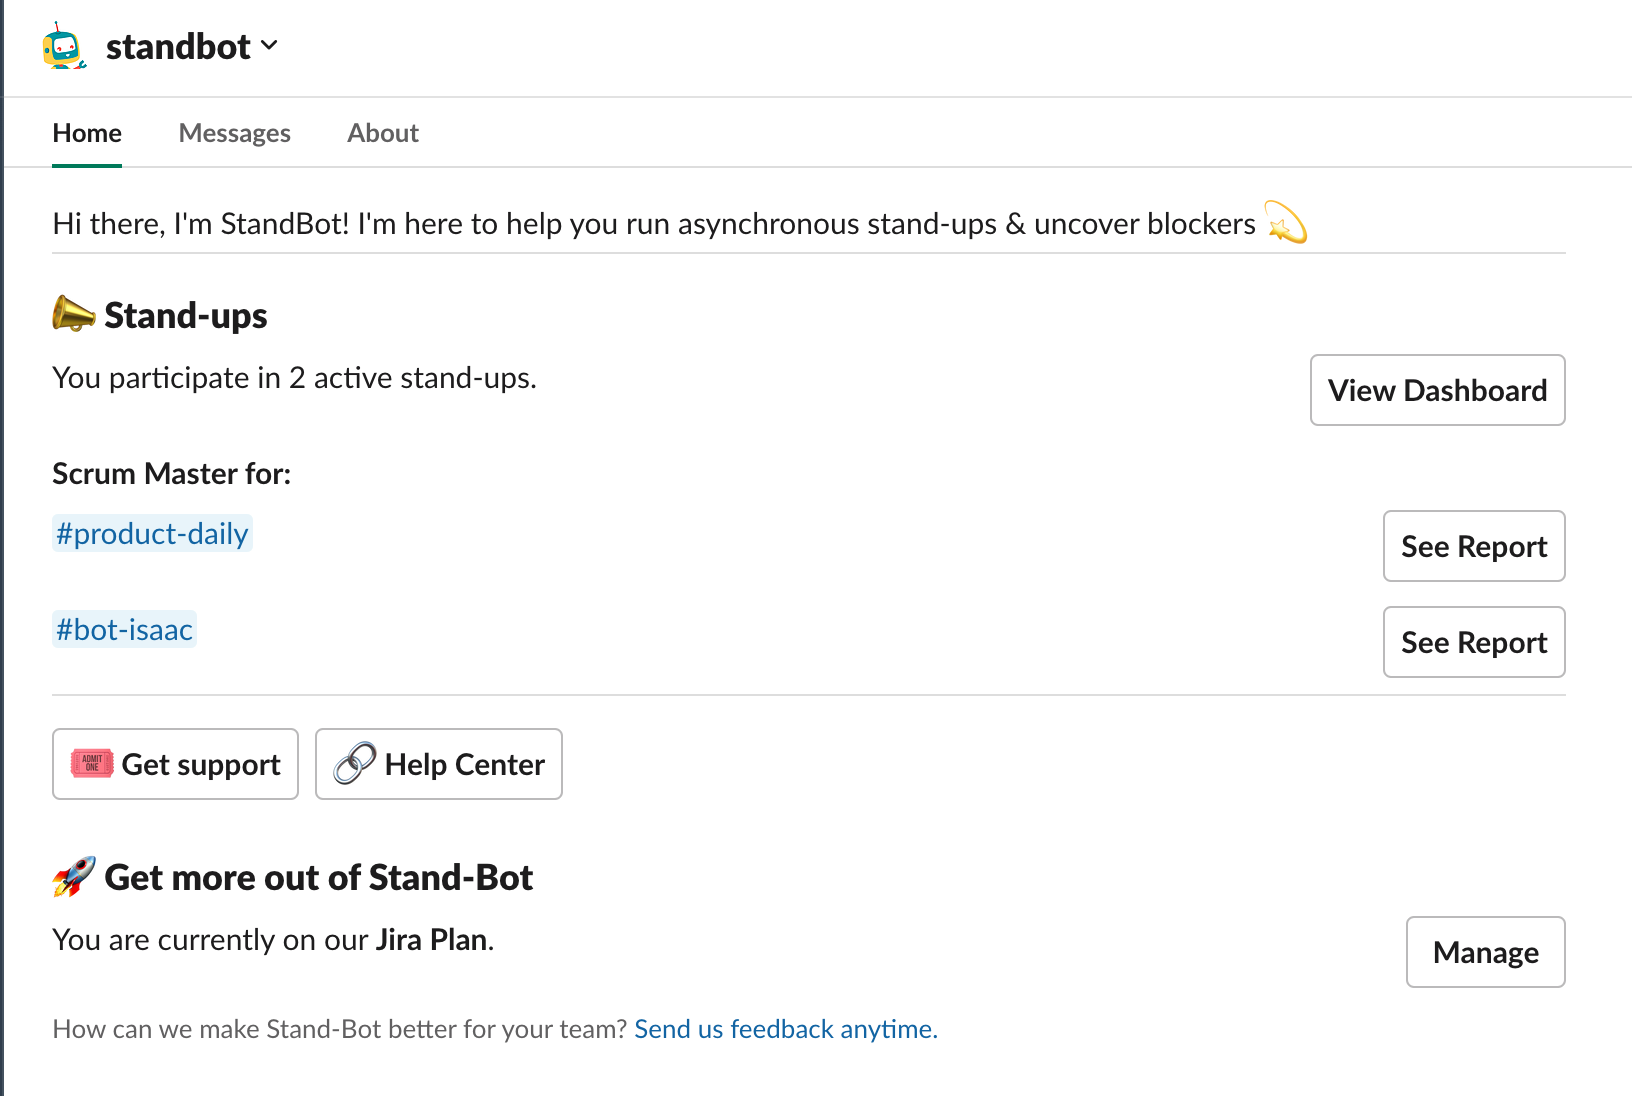
In the Home tab you will find the list of stand-ups you are part of as a participant or scrum master. If you click te channel name, you’ll be sent to the channel in which the stand-up takes place.
You can access the web report generated automatically and review past dates, as well as download the data associated to that report by clicking the ‘See Report’ button.
If you click the ‘View Dashboard’ button you’ll find the web dashboard.
Web Dashboard
The web dashboard contains all the stand-up in which you participate. Every stand-up listed has the option to:
- Access the web report
- Edit settings
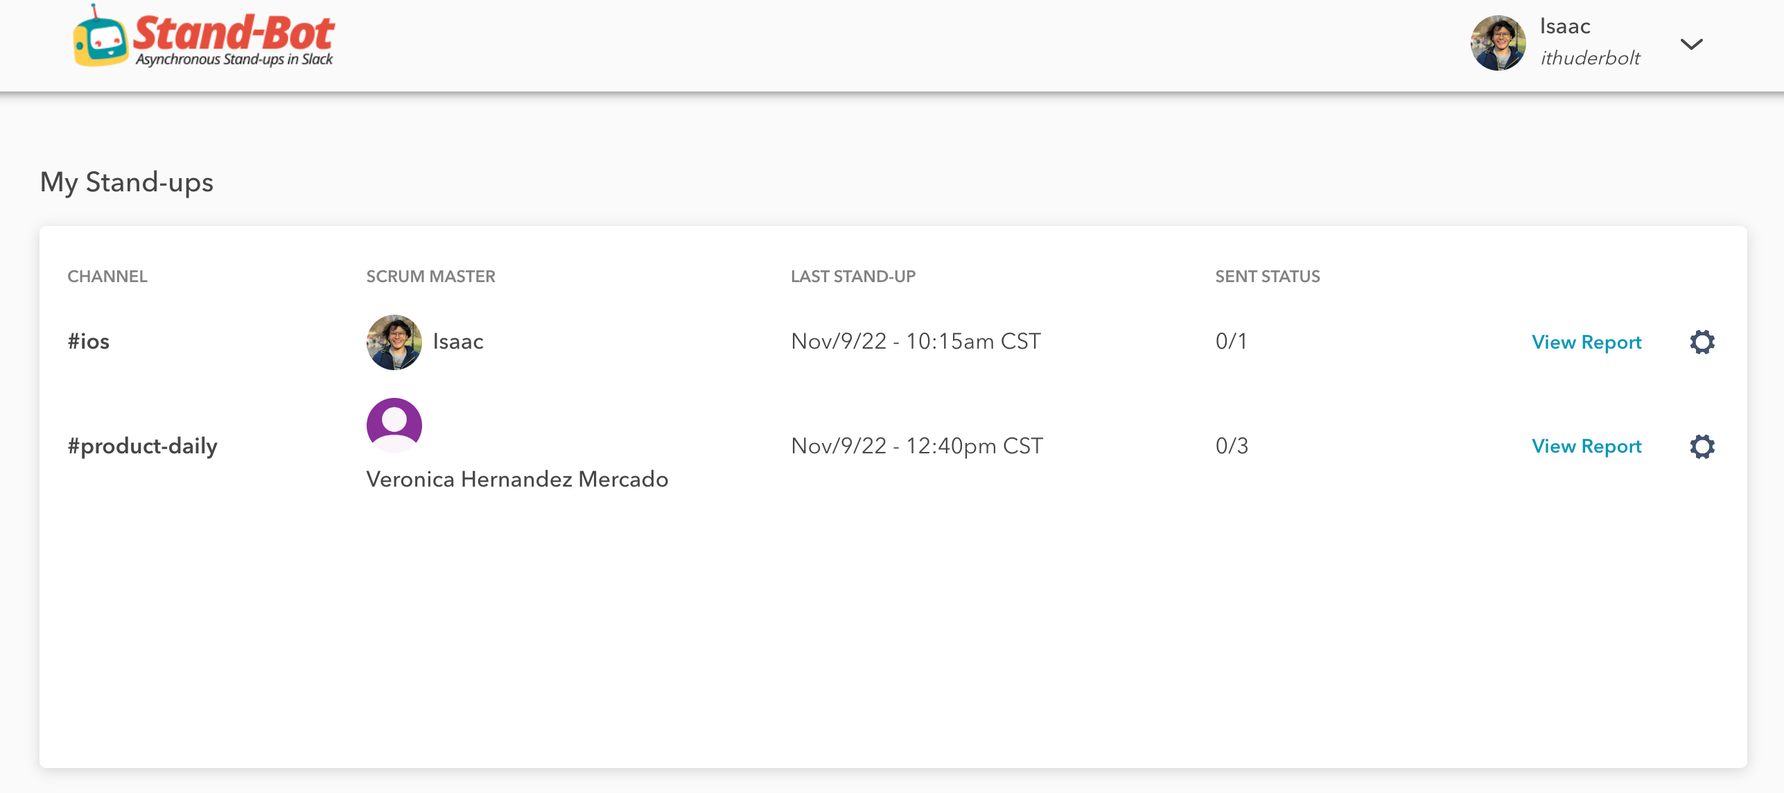
So every time you want to review or change the configuration of this stand-up you can go directly to this page and select the stand-up you want to work on.
Jira Dashboard
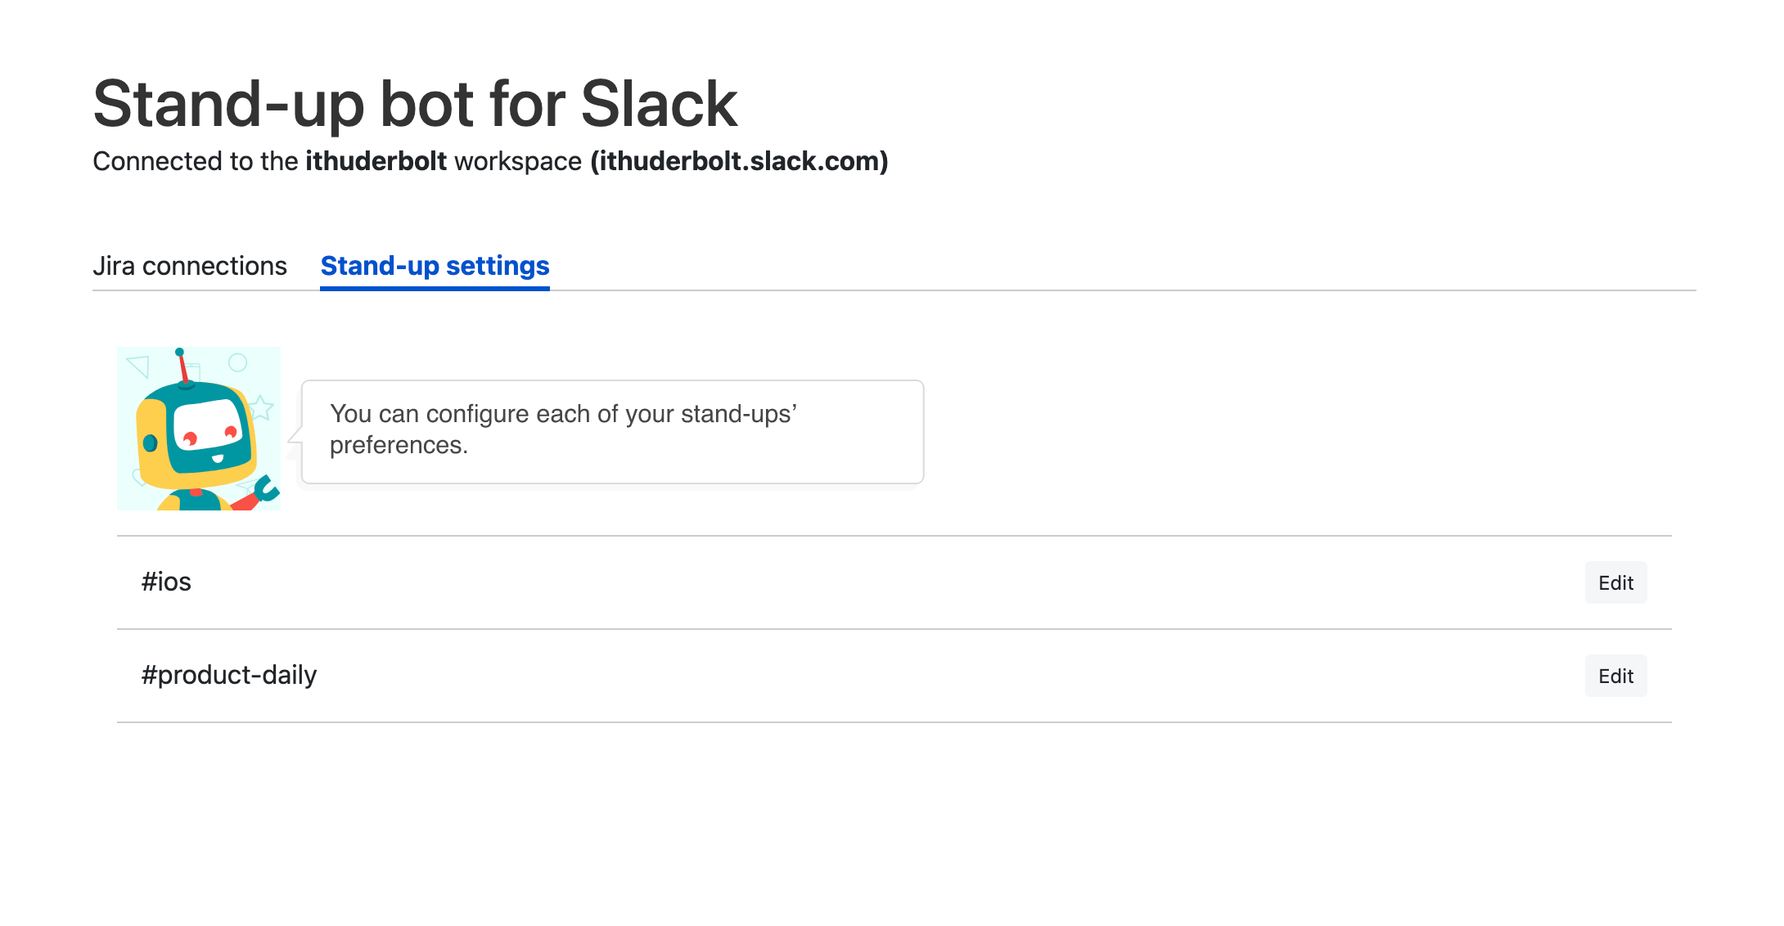
If you’re using the Jira Integration you have access to the web dashboard and additionally you can find the list of stand-ups by accessing the configuration page of StandBot in Jira. You’ll have to follow the next route starting on top navigation bar: Apps > Manage your Apps > StandBot > Configure
You need admin permission to access the stand-up settings in Jira.
There you’ll find your Jira connections and by clicking on the Stand-up settings tab, the list of stand-ups and the Edit button to change configurations.
If you want to access the stand-up report you just have to go to your project and click on the Stand-up Reports option in your side bar menu.
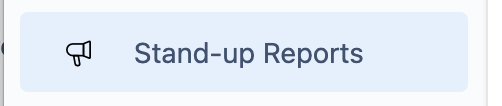
There you’ll find your stand-up reports.
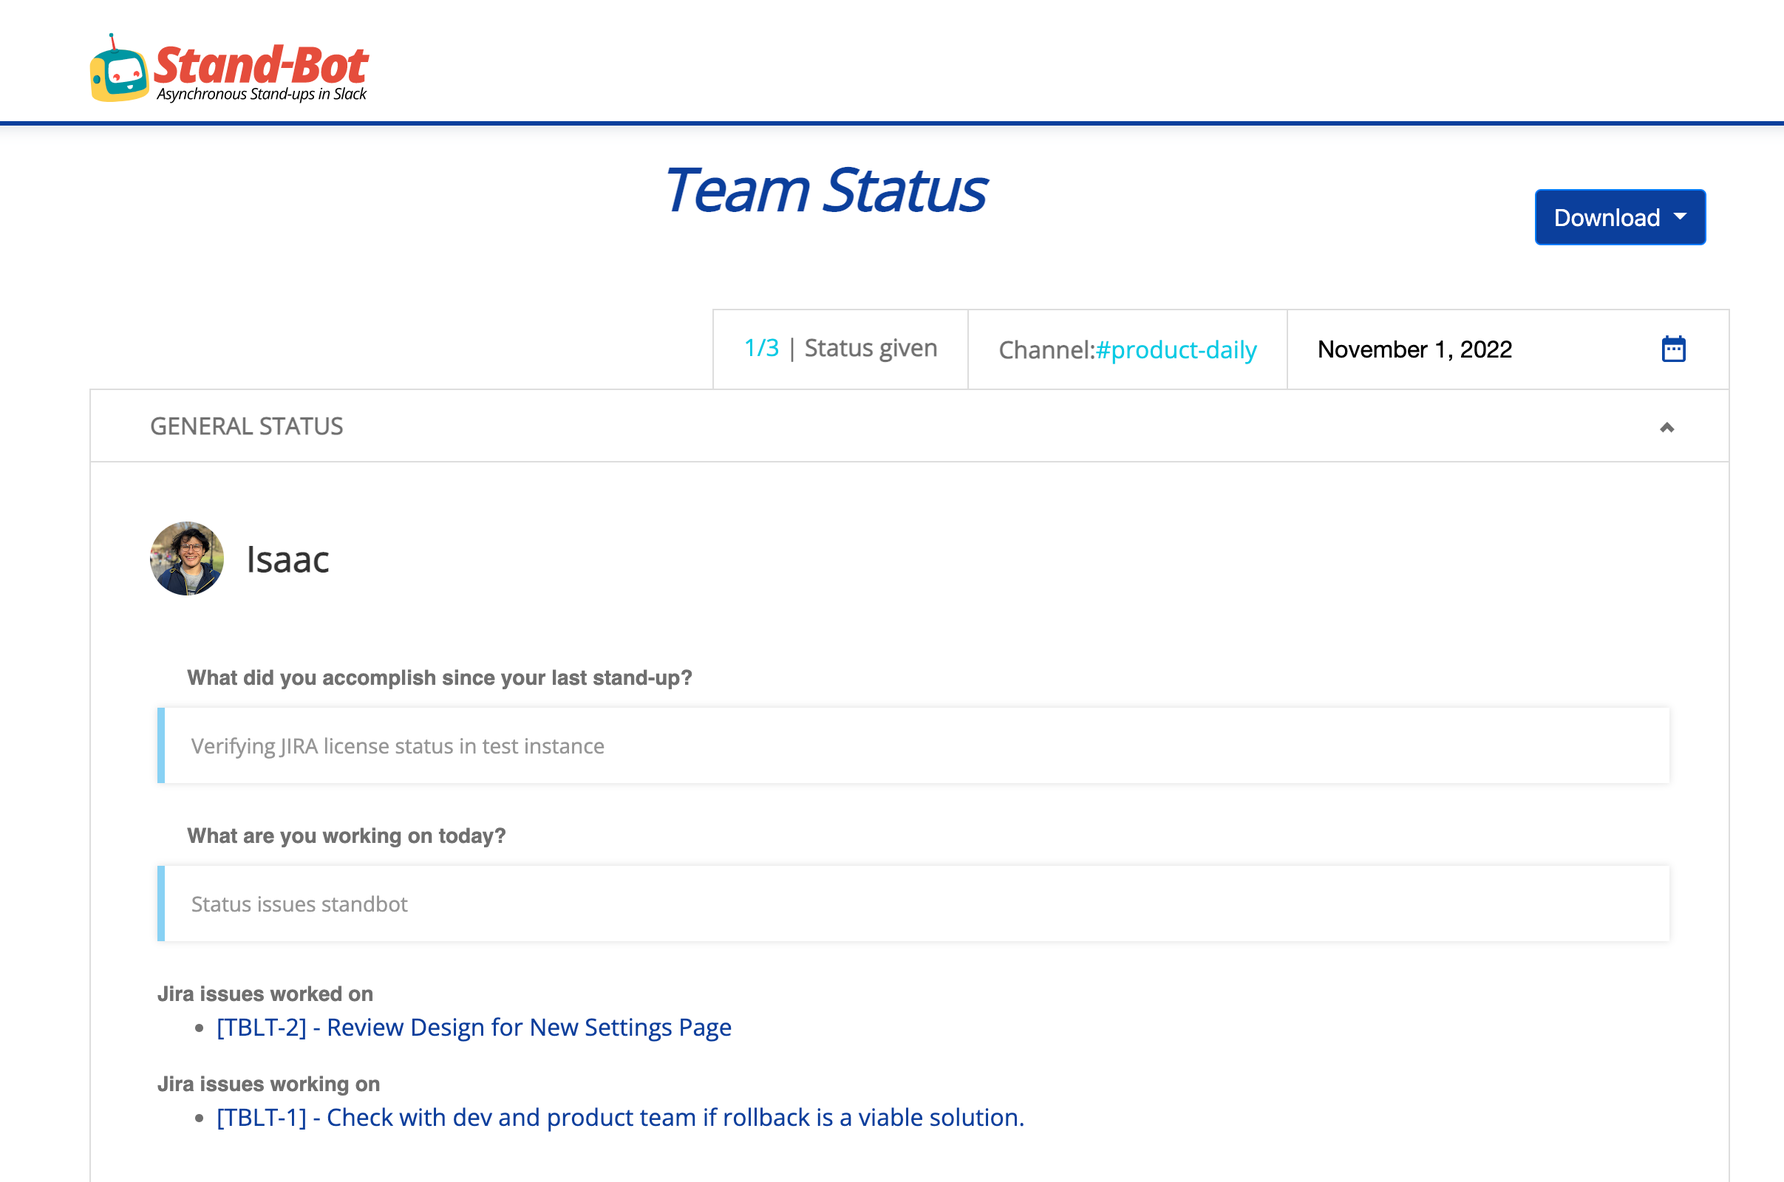
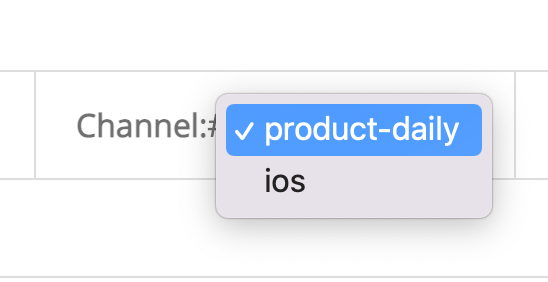
If you want to navigate the different reports, you can use the dropdown in the Channel section and select the stand-up you want to display: